Spotify Song Popularity Prediction

Unquestionably, Spotify now dominates the music streaming sector. Being able to gauge a song's potential popularity in advance could be valuable for artists and record labels. Due to the widespread use of digital music platforms (such as Spotify, Billboard, and Apple Music), data can be conveniently accessed, and listener behavior can be easily tracked. This makes forecasting methods more convenient, and it's also widely employed in recommendation systems.The purpose of this project is to identify what make a song popular. Record label companies and artists can use this data to maximize profits by producing music that matches the identified popular parameters.
The data used in this project has been gathered from Kaggle, and consist of 15 features describing the songs.

The data originally had 15 columns and 18,835 rows, and after removing duplicates it had 3,070 observations.Further for ease of analysis, We also changed the data in the song_duration_ms column to minutes and subsequently renamed that column.
To identify and classify songs as popular and not popular we took 90th percentile of the song_popularity variable. Using this value( 72) as a threshold to song popularity we classified all the songs with a song_popularity value less than 72 as 0(Not Popular) and songs from 72 and above to 1(Popular).

Above are distribution plots for some of the variables in our dataset. We see some variability in the dataset. To improve the quality of the data and analysis we standardized the data before applying models for predictions.
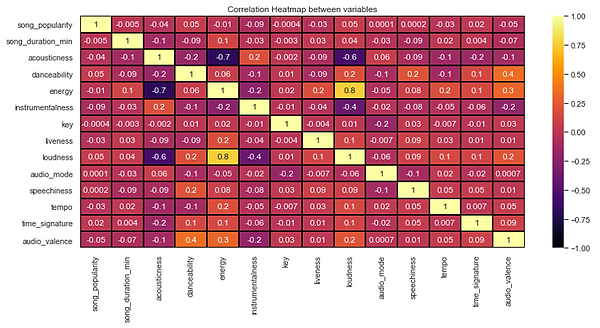
The target variable Song Popularity is most correlated to danceability and loudness(=0.05) and is least correlated to instrumentalness. The two most correlated variables in the map are energy and loudness (=0.8) and The two least correlated variables are energy and acousticness. All of the correlations are quite weak, with the exception of two. We don't observe a strong correlation (a linear relationship) that provides us with clear information about song popularity when we compare the correlation between song popularity and all other variables.
Popularity Prediction Model:

Based on sensitivity and accuracy Decision Trees performed best. And Based on Decision Tree, the below graph displays the variable of highest importance to most accurately predict the model
